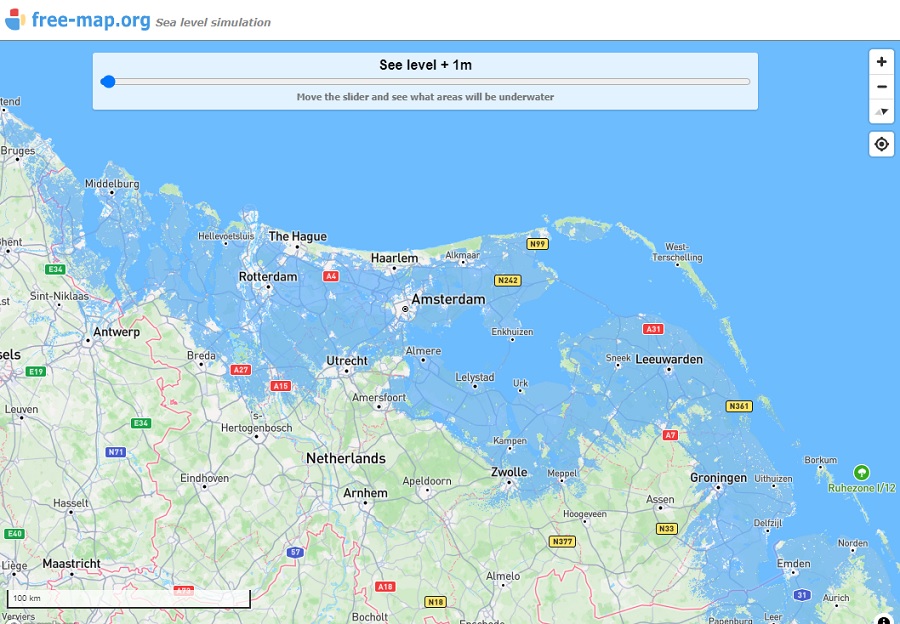
The map allows you to see what areas will be under water, when the sea level rises by a preset number of meters.
Map free-map.org/seelevel/ shows how rising sea levels might effect coastlines around the world.
Using the simulator you can adjust the height of the sea around the world (0 – 300).
The control allows you to adjust the sea level visualized on the map in 1 meter increments.
The application is only an illustrative simulation created based on the Mapbox GL JS library and NMT AWS Terrain Tiles. The visualization does not take into account anthropogenic structures, including embankments, dikes or dykes.
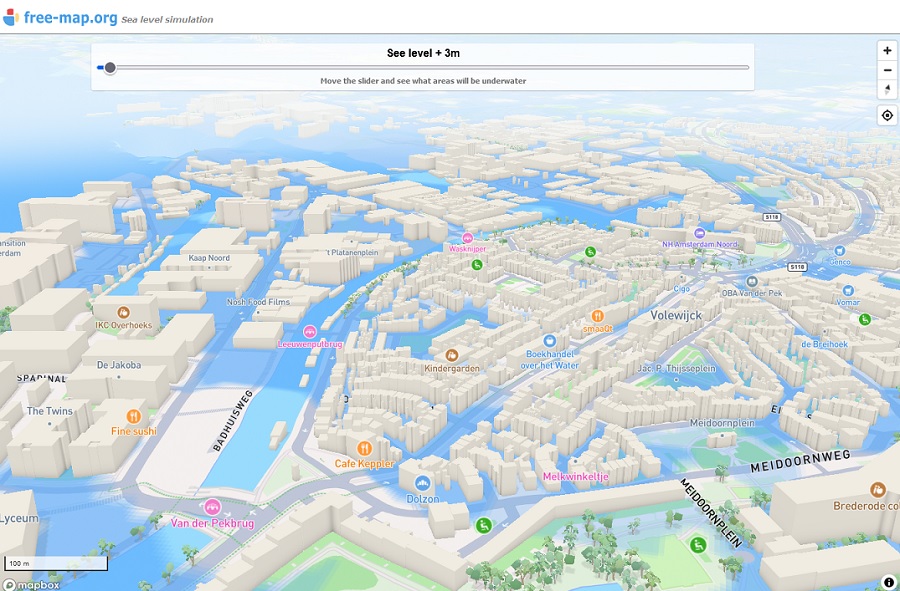
City of Amsterdam under water as water level rises 3 metres
The map is able to give an idea of the problem we will face in the near future. A rise in sea levels of just 1-2m could have catastrophic consequences, as can be seen in Europe. A rise of 1-2m would result in the complete flooding of coastal areas in particular, virtually the entire continent. Northern Germany, eastern Italy including Venice or the Netherlands, where almost half of the area would be under water, would be particularly affected.